

How to Track Household Sustainability Expenses and ROI
The most effective system for tracking household sustainability costs combines three steps: record your baseline consumption, log every project cost net of incentives, and reconcile monthly savings against that net cost. Start here in the next 72 hours:
- Pull 12 months of utility bills and compute your average monthly kWh, gallons, and fuel spend.
- Log every installation invoice, loan term, and incentive (federal, state, local) for each system you own or plan to install.
- Create one spreadsheet row per system with a monthly reconciliation column that subtracts actual utility costs from your pre-installation baseline.
Resources that belong in every U.S. homeowner’s bookmarks: the U.S. Department of Energy for payback guidance, DSIRE for state and local incentives, EnergySage for solar quotes and benchmarks, and Gridwiseliving for durable home systems across solar, greenhouses, generators, and water filtration.
Key Takeaways
Tracking household sustainability costs comes down to one repeatable system: baseline consumption, net project cost after incentives, and monthly reconciliation against actual utility savings.
| Point | Details |
|---|---|
| Set a real baseline | Use 12 months of bills and compute all-in $/kWh including delivery fees and fixed charges. |
| Net cost drives payback | Subtract every incentive (DSIRE, IRS) from gross cost before running any payback formula. |
| Simple payback formula | Net cost ÷ Year-1 savings; add 3% annual escalation to sharpen the estimate. |
| Budget replacement reserves | Divide replacement cost by service life (e.g., $100/year for a $1,500 inverter over 15 years). |
| Gridwiseliving systems | Solar kits, greenhouses, generators, and water filtration products map directly to every tracking category above. |
Table of Contents
- What cost and savings categories should you track for each system?
- How do you set a baseline for energy, water, and fuel use?
- How do you record installation costs, financing, and incentives to get net cost?
- How do you calculate payback period and simple ROI?
- How do you track maintenance, replacements, and consumables?
- What does a practical tracking spreadsheet look like?
- What are the most common tracking mistakes to avoid?
- Two realistic U.S. examples you can replicate
- How do you turn tracked numbers into keep, expand, or divest decisions?
- Gridwise Living’s perspective on tracking sustainability expenses
- Gridwiseliving products that work with this tracking system
- Authoritative U.S. resources to bookmark
- Sources
What cost and savings categories should you track for each system?
Every sustainability system shares the same eight cost buckets, but the line items inside each bucket differ. The table below maps categories to the five most common home systems.
| Category | Solar | Battery | Generator | Water Filtration | Greenhouse |
|---|---|---|---|---|---|
| Installation | Equipment + labor | Equipment + labor | Equipment + labor | Equipment + labor | Structure + labor |
| Financing | Loan APR, term | Loan APR, term | Loan APR, term | Loan APR, term | Loan APR, term |
| Incentives | Federal ITC, state rebates | State rebates | None typical | None typical | None typical |
| Operating | Minimal | Minimal | Fuel, oil | Water, electricity | Water, electricity, seeds |
| Maintenance | Annual inspection | Annual check | Quarterly service | Filter replacements | Seasonal supplies |
| Replacement | Inverter (12–15 yr) | Battery bank (8–12 yr) | Engine overhaul | Filter stages (6–12 mo) | Glazing, hardware |
| Avoided utility savings | Electricity offset | Backup power value | Outage fuel cost | Bottled water cost | Grocery spend |
| Resale value | Home value increase | Marginal increase | Marginal increase | Minimal | Minimal |
Net cost for owned systems: subtract all upfront incentives and rebates from the total installed price. For leased systems or power purchase agreements (PPAs), net cost is effectively zero upfront, but you give up the tax credit and your “savings” are the spread between your PPA rate and the utility rate. Track them separately; the payback math is fundamentally different.
For greenhouse cost tracking, the avoided-savings row converts annual harvest into equivalent grocery dollars, which is the cleanest way to build a defensible payback number.
How do you set a baseline for energy, water, and fuel use?
You cannot measure savings without a “before” number. Here is a step-by-step process:
- Collect 12 consecutive months of utility bills (electric, gas, water, propane).
- For electricity, compute your all-in $/kWh: total annual bill ÷ total annual kWh.
- For water, compute cost per gallon or per CCF from the same bills.
- For fuel, log gallons purchased and total cost per fill-up over 12 months.
- Average each metric monthly so seasonal swings don’t distort your baseline.
Pro Tip: Include delivery fees, taxes, and fixed monthly charges in your all-in $/kWh rate. These non-bypassable costs often add $0.03–$0.06/kWh to the supply rate, and whether solar offsets them depends on your utility’s net-metering rules. Using only the supply rate understates your true savings potential.
If you only have dollar totals and no kWh data, use this quick conversion: (monthly $ ÷ all-in $/kWh) × 12 = annual kWh estimate. NREL’s PVWatts calculator can then cross-check whether that consumption aligns with a reasonably sized solar array for your location.
Household size matters here. A 1,500 sq ft home and a 3,500 sq ft home have very different baselines, and smaller homes cost less to heat, which compresses the solar savings opportunity. Adjust your baseline assumptions accordingly before sizing any system.
How do you record installation costs, financing, and incentives to get net cost?
Net cost is the single number that drives every payback and ROI calculation. Getting it right means accounting for all three inputs: gross cost, financing terms, and incentives.
For a cash purchase:
- Net cost = (equipment + labor + permitting + sales tax) minus (federal tax credit + state rebate + utility rebate)
For a financed purchase:
- Net cost = same as above, but you also record: loan principal, APR, term (months), and monthly payment.
- Annual loan cost = monthly payment × 12.
For a lease or PPA:
- Net cost = $0 upfront; track monthly PPA rate vs. utility rate instead.
Check DSIRE for every state and local incentive before finalizing your net cost number. For the federal residential solar credit, confirm current eligibility directly with IRS guidance. Note that as of 2026, the federal residential tax credit is $0 for cash and loan systems, so state and local incentives are now the primary upfront reductions.
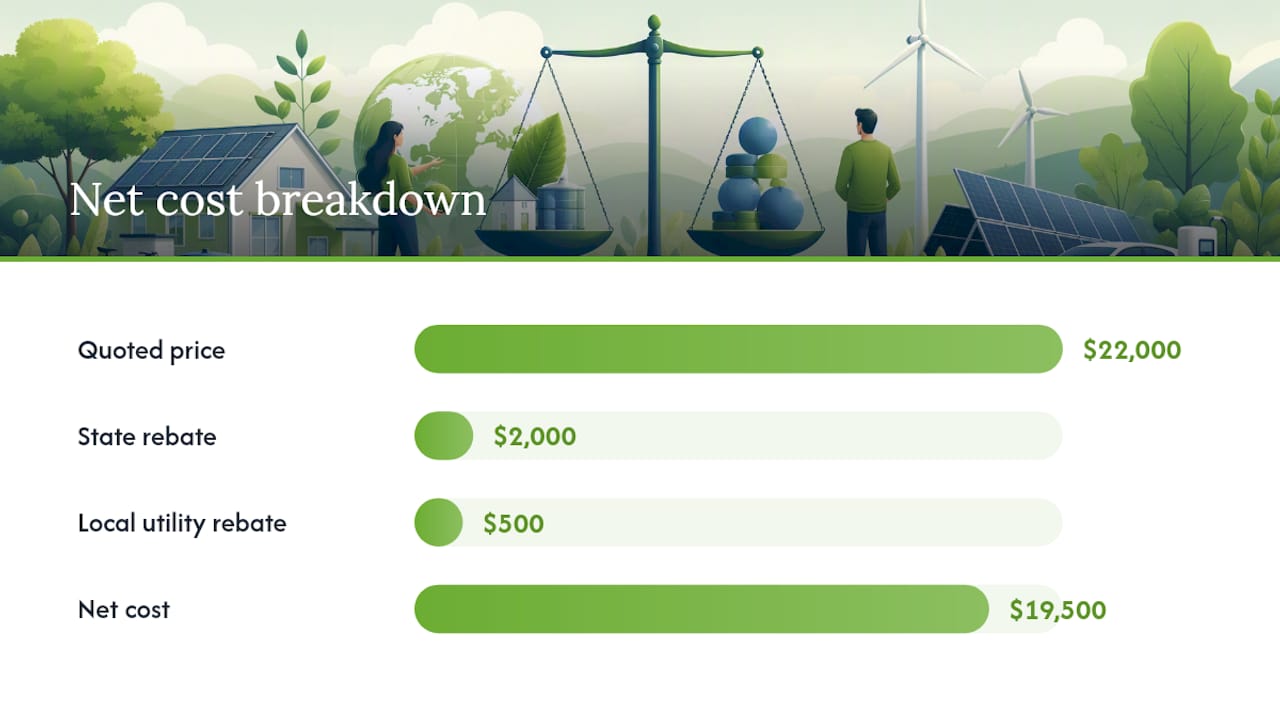
Worked example (cash purchase):
- Quoted price: $22,000 (8 kW system)
- State rebate: $2,000
- Local utility rebate: $500
- Net cost: $19,500
How do you calculate payback period and simple ROI?
The DOE’s three-step payback method is the standard starting point: subtract incentives from gross cost, compute annual savings from utility bills, then divide.
Core formulas:
- Year-1 savings = min(annual production, annual usage) × all-in $/kWh
- Simple payback = Net system cost ÷ Year-1 savings
- For financed systems: Net annual benefit = Year-1 savings minus annual loan payments
Worked example (continuing from above):
- 8 kW system, production ratio 1.3 (a conservative US average)
- Year-1 production estimated from system size and production ratio
- Annual usage reflects sample household consumption
- Estimated all-in electric rate used
- Year-1 savings estimated by multiplying production by rate
- Simple payback: $19,500 ÷ $1,456 = ~13.4 years
OhmSnap’s 2026 ROI framework runs similar state-level examples and shows how IRR and NPV shift when export rates and escalation assumptions change.
Simple payback is what most homeowners use. IRR and NPV matter when you’re comparing solar against a home equity investment or a stock portfolio, but for a keep/expand/divest decision, payback period is faster and easier to defend.
How do you track maintenance, replacements, and consumables?
A maintenance log prevents the most common ROI error: treating a $3,000 inverter replacement as a surprise rather than a planned cost. Build your log with these fields:
- System ID and install date
- Component serial numbers
- Expected replacement interval
- Last service date and cost
- Next scheduled service date
- Vendor/installer contact
Replacement cycles to budget for:
- Solar inverter: every 12–15 years, typically $1,000–$2,000
- Battery bank: every 8–12 years depending on cycle depth
- Water filter stages: every 6–12 months per stage (track with an app like Water Purifier Diary)
- Generator service: quarterly oil/filter check, annual tune-up
- Greenhouse glazing and hardware: inspect annually, budget for replacement every 10–15 years
Pro Tip: Set an annual replacement reserve equal to total replacement cost ÷ expected years of service. For a $1,500 inverter with a 15-year life, that’s $100/year. Add this to your annual operating cost before computing ROI so the math reflects real total cost of ownership.
For water filtration systems, missed filter replacements don’t just inflate costs — they degrade water quality. A dedicated reminder app or a calendar entry per filter stage keeps this category from slipping.

What does a practical tracking spreadsheet look like?
A single spreadsheet with one row per system handles everything. Core columns:
| Column | What to enter |
|---|---|
| System | Solar, battery, generator, water filter, greenhouse |
| Install date | MM/YYYY |
| Net cost ($) | After all incentives and rebates |
| Annual production/output | kWh, gallons, lbs produce |
| All-in $/unit | $/kWh, $/gallon, $/lb grocery equivalent |
| Year-1 savings ($) | Production × $/unit |
| Annual escalation (%) | 3% default for electricity |
| Cumulative savings ($) | Running total, year by year |
| Payback year | Year cumulative savings = net cost |
| Annual maintenance reserve ($) | Replacement cost ÷ service life |
Update cadence: reconcile monthly (actual utility bill vs. baseline), refresh ROI annually, and update immediately after any rate-plan change, maintenance event, or system modification.
Pro Tip: *Use EnergySage to benchmark your solar quotes against regional averages before entering your net cost.
For greenhouse projects, use the AgentCalc greenhouse payback calculator to convert annual yield into store-equivalent dollars, then plug that annual savings figure into your spreadsheet.
What are the most common tracking mistakes to avoid?
Red flags in your spreadsheet:
- Using only the supply rate (not all-in $/kWh) — understates savings
- Double-counting a tax credit as both a rebate and a tax filing reduction
- Capping credited solar production above actual household usage (net-metering rules usually prevent this)
- Omitting inverter or battery replacement reserves from annual costs
- Using a single-year utility rate with no escalation assumption
10-minute sanity check:
- Compare year-1 modeled production to NREL PVWatts output for your zip code and system size.
- Cross-check utility-billed kWh against your meter reads for the same period.
- Verify every incentive on DSIRE and confirm federal credit eligibility on the IRS site.
- Confirm your all-in $/kWh includes fixed charges and delivery fees.
- Check that cumulative savings in year 1 is less than net cost (if not, recheck your inputs).
Two realistic U.S. examples you can replicate
Case A: Cash purchase
- 8 kW system, quoted $22,000
- State rebate $2,000, local rebate $500
- Net cost: $19,500
- Year-1 savings: approximately $1,450 based on average rates and production
- Simple payback: roughly a decade or more, varying by local factors
Case B: Financed purchase (same system)
- Net cost: $19,500 financed at 7% APR over 8 years
- Monthly payment: around typical loan payments based on sample APR and term
- Net annual benefit (year 1): slightly negative cash flow while loan is active
- The system cash-flows positively only after the loan is paid off; total payback from install date is approximately 18–19 years at flat rates, shorter with escalation.
These numbers mirror the conservative modeling defaults in OhmSnap’s 2026 framework. For greenhouse payback, Sierra Greenhouse’s ROI calculator uses the same structure: setup cost ÷ (annual produce value minus operating cost) = break-even years.
How do you turn tracked numbers into keep, expand, or divest decisions?
Once your spreadsheet has 12–24 months of real data, three decision triggers become clear:
- Keep: Payback is on track or ahead of schedule, maintenance costs are within reserve, and you plan to stay in the home past the payback year.
- Expand: Year-1 IRR exceeds your alternate investment return (e.g., a 7% stock market average), and your roof or property can support additional capacity.
- Divest or replace: Projected payback exceeds the system’s remaining useful life, or annual maintenance costs are rising faster than avoided utility savings.
Ask these questions when a project looks marginal:
- How many more years do you plan to stay in the home?
- Does the system add measurable resale value in your market?
- Does the resilience value (backup power, water independence, food security) justify a longer payback?
For self-sufficient home living, resilience often justifies a payback period that pure ROI math would reject. A generator or water filtration system that keeps your family running during a grid outage has value that doesn’t show up in a kWh savings column.
Gridwise Living’s perspective on tracking sustainability expenses
At Gridwiseliving, we see the same pattern repeatedly: homeowners invest in solar, a greenhouse, or a water filtration system, then lose track of whether it’s actually paying off. The tracking system described here is the same framework we recommend to every customer. Every product Gridwiseliving sells — solar energy kits, whole-home generators, water filtration systems, greenhouses, and tiny homes — maps directly to the cost categories and maintenance fields in this article. When you know your net cost, your annual savings, and your replacement reserve, you make better decisions about what to buy next and when to upgrade. The numbers also give you something concrete to show a home appraiser or a buyer, which is where the resale-value row in your spreadsheet earns its keep.
Gridwiseliving products that work with this tracking system
Gridwiseliving builds its product line around the same cost categories this article covers. A solar energy system from Gridwiseliving slots directly into the payback spreadsheet: net cost after state rebates, annual kWh production, and a 12–15 year inverter replacement reserve. A greenhouse kit feeds the avoided-grocery-spend row. Backup power options like the Powerhouse Gen 2 give you a concrete replacement-cycle cost to budget. Every product page lists the specs you need to fill in your tracking template on day one. Browse the full range at Gridwiseliving and start with the system that has the shortest payback for your household.

Authoritative U.S. resources to bookmark
- U.S. Department of Energy — Solar Savings: Step-by-step payback calculation, ownership model comparisons, and net-metering guidance.
- DSIRE: The definitive database for state, local, and utility incentives — check before finalizing net cost.
- IRS Residential Clean Energy Credit: Confirm current federal credit eligibility and filing requirements.
- EnergySage: Solar quote marketplace and regional cost benchmarks for validating your net cost inputs.
- NREL PVWatts: Free production estimate by zip code and system size — use it to sanity-check your year-1 kWh projection.
- OhmSnap 2026 ROI Guide: State-level payback, IRR, and NPV examples using 2026 cost defaults.
- SnapToolSuite Solar Estimator: Free calculator with documented formulas for degradation, escalation, and cumulative savings.
- Sierra Greenhouse ROI Calculator: Greenhouse-specific payback tool that converts produce yield into avoided grocery spend.
- AgentCalc Greenhouse Calculator: Annual harvest-to-dollar conversion for greenhouse payback modeling.
This article is general information, not a substitute for advice from a qualified financial advisor. Consult a qualified financial professional about your own circumstances before acting on anything here.
Sources
- Will I save money with solar energy? | Department of Energy
- How to Calculate Your Solar ROI Without a Federal Tax Credit in 2026 | OhmSnap
- Solar Panel Savings Estimator (Free) — Payback & 25-Year ROI