

$15,000–$35,000: U.S. Home Solar Cost in 2026 After the 30% Credit
Most U.S. homeowners install solar for a mid-range cost before incentives, with the exact amount varying by system size and state. The biggest shift heading into 2026: the federal residential solar tax credit under Section 25D ended December 31, 2025, so that 30% write-off is gone for new homeowner-owned systems. Get at least three cash-equivalent quotes before you sign anything.
TL;DR:
- The federal residential solar tax credit of 30% ended December 2025, making the net cost of systems more transparent for new buyers.
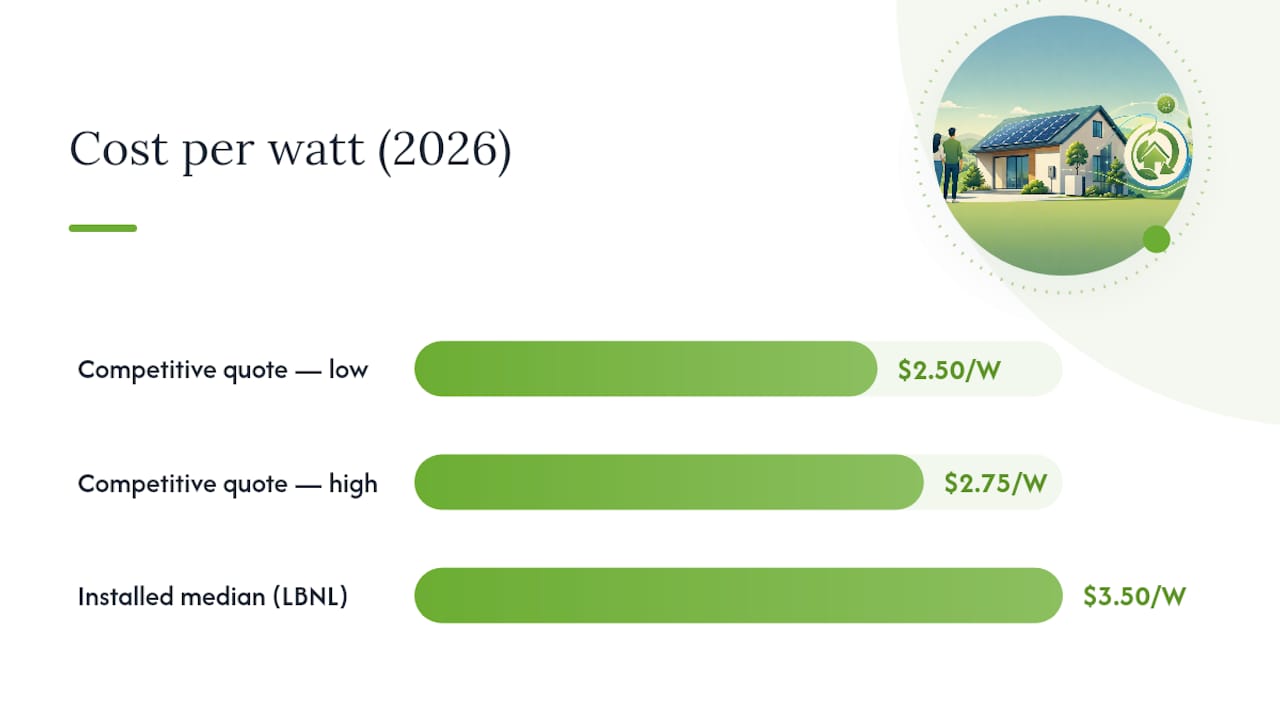
- Typical installed costs are around $2.50 to $2.75 per watt for competitive bids, but the broader median is closer to $3.50 per watt due to less aggressive shopping.
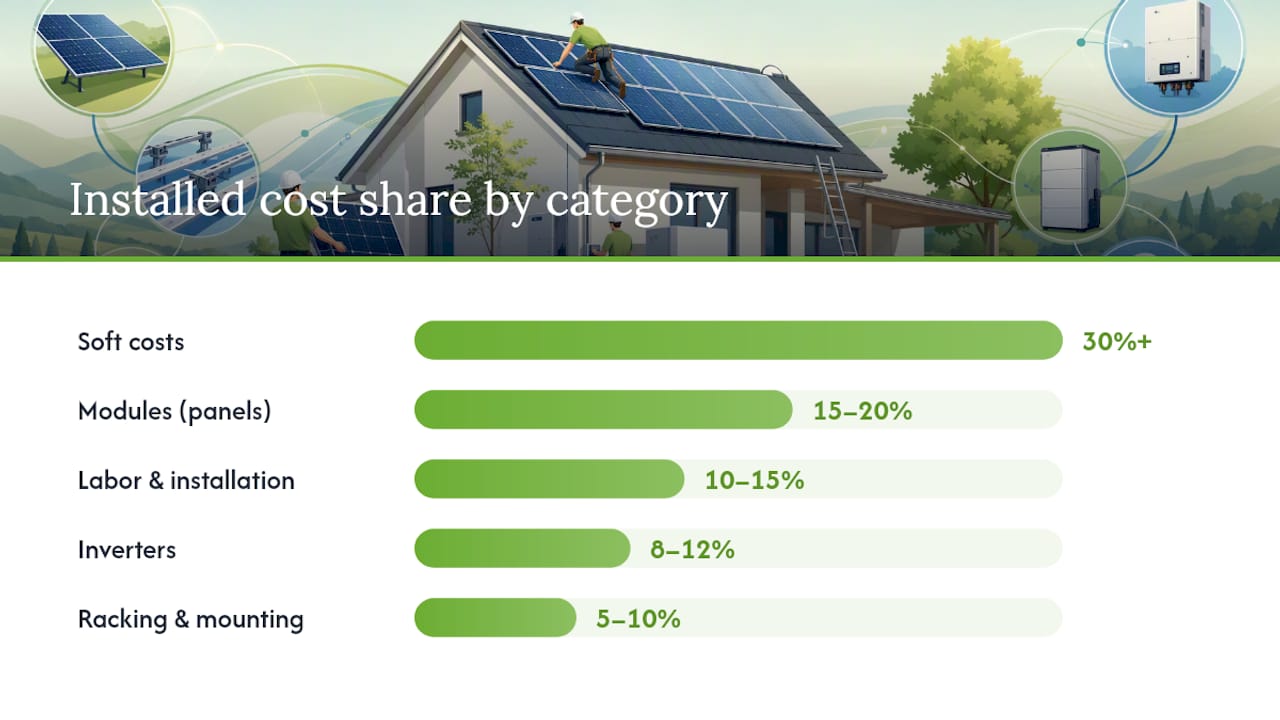
- Soft costs, such as permitting, inspection, and sales overhead, often account for over 30% of total system prices, surpassing hardware expenses.
- State and utility incentives now play a more significant role in reducing net costs, with net-metering policies greatly impacting payback timelines.
- Homeowners should request itemized quotes, compare $/W at the same capacity and ownership type, and model first-year production for accurate comparisons.
Table of Contents
- What Does Home Solar Cost per Watt in 2026?
- What Changes the Price: The Main Cost Drivers
- Financing and Incentives in 2026: What Can Still Lower Your Net Cost
- How to Get and Compare Accurate Solar Quotes
- Worked Examples by System Size and State
- How to Estimate Your Solar Payback and Savings
- How Gridwiseliving Helps You Plan and Size a System
- What I’d Tell a Neighbor Asking About Solar Costs
- Gridwise Living’s Solar Products for Homeowners on a Budget
- Sources
What Does Home Solar Cost per Watt in 2026?
The dollar-per-watt figure you see quoted online depends heavily on where that number comes from, and that gap trips up a lot of homeowners. Competitive marketplace quotes, the kind generated when multiple installers bid on the same job, tend to cluster around $2.50 to $2.75 per watt. But broader installed-price medians pulled from actual completed projects, tracked by Lawrence Berkeley National Laboratory, run closer to $3.50 per watt. That’s not a typo or a regional quirk. It reflects the difference between homeowners who shopped aggressively across several bids and the average buyer who took the first solid offer.
Ownership type matters too. A cash purchase, a loan, and a lease all produce different effective $/W numbers because financing costs, dealer fees, and margin get baked into leased or financed contracts in ways a straight cash quote never shows.
Here’s how that plays out across common system sizes, with estimated cost ranges before any incentives varying by system size and other factors:
| System size | Estimated cost range | Typical use case |
|---|---|---|
| 5 kW | a typical lower to mid cost range | Smaller home, low usage, or partial offset |
| 7 kW | a typical mid-range cost | Average single-family home |
| 10 kW | a typical higher cost range | Larger home or high electric usage (EV, pool) |
| 12 kW | a higher-end cost range | Big roof, heavy consumption, or future EV plans |
These bands echo the roughly $15,000 to $35,000 gross-cost range that market trackers report for typical residential installs before incentives, though your exact number depends on your roof, your utility territory, and how competitively you shop your quote.
What Changes the Price: The Main Cost Drivers
A solar quote isn’t just “panels times watts.” It’s a stack of hardware and labor costs, and knowing where each dollar goes helps you spot a padded quote when you see one. NREL’s cost benchmark research breaks a typical installed price into these rough categories:
- Modules (panels): Usually 15% to 20% of total cost, though premium high-efficiency panels push this higher.
- Inverters: Roughly 8% to 12%, with string inverters cheaper than microinverters or hybrid inverters built for battery pairing.
- Racking and mounting: Around 5% to 10%, higher on tile or metal roofs that need special flashing.
- Labor and installation: Often 10% to 15%, and this climbs fast if your roof needs structural work, old shingles removed, or extensive rewiring.
- Permits, inspection, and interconnection: Typically 5% to 10%, and this varies a lot by city and utility.
- Soft costs (sales, overhead, customer acquisition, financing): Frequently the largest single bucket, sometimes 30% or more of the total.
Statistic Callout: Soft costs, not hardware, are often the single biggest line item in a residential solar quote, a pattern documented across a decade of NREL’s cost tracking as hardware prices fell faster than sales and overhead expenses did.
Roof complexity is the wildcard installers love to underquote. A simple south-facing roof with no shade costs less to install than a steep roof cut up by dormers, chimneys, or heavy tree shade requiring extra racking and rewiring. Panel tier matters too. Premium modules with stronger warranties and higher efficiency ratings cost more per watt but can shrink the number of panels you need. Add a battery and you’re looking at a separate cost bucket entirely, one that can add tens of thousands depending on capacity.
Financing and Incentives in 2026: What Can Still Lower Your Net Cost
The single biggest change for 2026 buyers is that the federal residential credit under Section 25D is gone. It expired December 31, 2025, which means the gross installed price you’re quoted is now much closer to your actual out-of-pocket cost than it was for anyone who installed the year before. State and utility programs are now doing most of the heavy lifting on reducing net cost.
Here’s how to work through what’s still available to you:
- Check your state’s incentive database. DSIRE (the Database of State Incentives for Renewables and Efficiency) tracks state rebates, property tax exemptions, and sales tax exemptions by state.
- Look up your utility’s net-metering or export compensation policy. Some utilities still credit exported solar power near retail rates; others pay a lower wholesale rate, which changes your payback math substantially.
- Compare cash purchase, loan, and lease/PPA structures side by side. A cash purchase gives you the lowest lifetime cost and full ownership. A solar loan spreads cost but adds interest. A lease or power purchase agreement (PPA) can mean $0 down, but you never own the system and savings are typically smaller.
- Ask every installer to itemize incentive value as a line item, not folded into a vague “after incentives” number that hides the math.
Pro Tip: *Ask specifically whether a quoted “monthly payment” includes a dealer fee baked into the loan.
How to Get and Compare Accurate Solar Quotes
Comparing quotes side by side only works if you’re comparing the same thing. Installers pad numbers differently, bundle costs differently, and quote different equipment tiers, so an apples-to-apples comparison takes some deliberate legwork on your part.
- Request the cash-equivalent total first, even if you plan to finance. This strips out dealer fees and loan interest so you can see the real hardware-and-labor price.
- Ask for separated subtotals: PV modules, inverter, racking, labor, permitting, and battery (if included) each listed on their own line.
- Compare $/W using the same DC capacity and ownership structure. A 7 kW system quoted at $2.60/W and one quoted at $3.10/W for identical equipment is a real difference worth questioning.
- Request modeled first-year production numbers, ideally generated from NREL’s PVWatts or a comparable named weather-file model, not a rough installer guess.
- Review warranty coverage on three fronts: product warranty (usually 10 to 25 years on panels), performance warranty (guaranteed output over time), and workmanship/labor warranty (often shorter, 5 to 10 years).
Pro Tip: If two installers quote wildly different production estimates for the same roof and system size, ask each one what derate factor and weather file they used. A sloppy production estimate inflates your projected savings and quietly wrecks your payback timeline.
Watch for red flags: a quote with no itemized subtotals, a “special today only” discount pressure tactic, or a production estimate that seems suspiciously optimistic compared to a PVWatts run for your address. Any of those is a reason to get a second opinion before signing.
Worked Examples by System Size and State
These numbers are planning anchors, not a substitute for a site-specific quote, since your roof and utility rates will move the final number.
State context matters as much as the per-watt number. A homeowner in a state with high retail electricity rates and strong net-metering sees a faster payback even at the higher end of the installed-price range, because every exported kilowatt-hour offsets more expensive power. A homeowner in a state with cheap electricity and weak export compensation might pay less upfront but wait years longer to break even. SEIA’s market reports track these state-level pricing and deployment differences if you want a broader national comparison.
How to Estimate Your Solar Payback and Savings
Payback math isn’t complicated once you have three numbers: your system’s expected annual production, your local electricity rate, and your total installed cost.
- Multiply annual kWh by your local rate from EIA’s electricity data to estimate first-year savings.
- Adjust for panel degradation (typically 0.5% per year) and expected utility rate inflation over the system’s life.
- Divide total installed cost by annual savings for a simple payback estimate in years.
Statistic Callout: A 7 kW system installed at a competitive price producing around 9,500 kWh annually and offsetting electricity at typical local rates can save a substantial amount in the first year, with simple payback periods varying widely depending on local factors and incentives.
Batteries change this math differently. A residential battery typically adds several thousand dollars to the installed cost, and its value also includes resilience during outages beyond simple bill savings. It’s about resilience during outages, which doesn’t show up in a payback spreadsheet but matters a great deal during a multi-day grid failure.
How Gridwiseliving Helps You Plan and Size a System
There are durable, straightforward solar products available for homeowners seeking more control over their energy and food security, and solar sizing is a common question. If you’re weighing a smaller footprint, our guide on solar for tiny houses walks through sizing math for compact systems, and our tiny-home solar guide covers how energy needs shift with smaller living spaces. Both are practical starting points before you request a formal quote.
What I’d Tell a Neighbor Asking About Solar Costs
Size your system to your actual usage, not to a salesperson’s suggested “standard” package. Get three cash-equivalent quotes with itemized subtotals before comparing anything, and treat battery cost as a separate decision built around resilience, not just bill savings. If you’re exploring smaller or portable setups, a solar sizing guide is a reasonable place to start browsing options.
— Gridwise
Gridwise Living’s Solar Products for Homeowners on a Budget
If you’d rather skip the quote-comparison marathon entirely, An alternative to the traditional multi-bid installer process is a packaged solar hardware sized for real homes, with no dealer-fee guesswork buried in the price.

Our lineup spans portable kits for smaller energy needs, small-system kits for homeowners easing into solar without a full roof retrofit, and whole-home backup options like the Powerhouse Gen 2 whole home solar generator for households prioritizing resilience during outages. Each option is built for durability and straightforward setup, which matters if you’re trying to avoid the soft-cost markups that inflate a lot of installer quotes. If you’re also weighing what solar means for a home you might eventually sell, this resource on selling with solar panels is worth a read.
Ready to see what fits your roof and budget? Browse solar energy systems collection and compare packaged options sized for homes like yours.
Sources
- Distributed Solar & Storage — LBNL data update (2025)
- U.S. EIA electricity data and rates
- Solar Market Insight — SEIA (Q2 2026)